Product main features are described below
 Network control library:
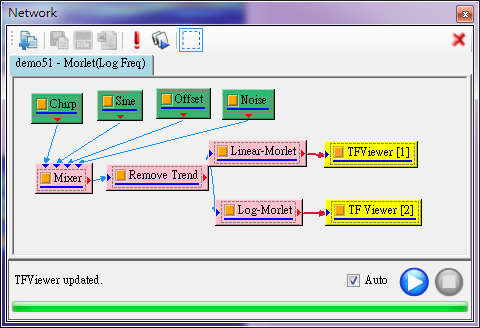
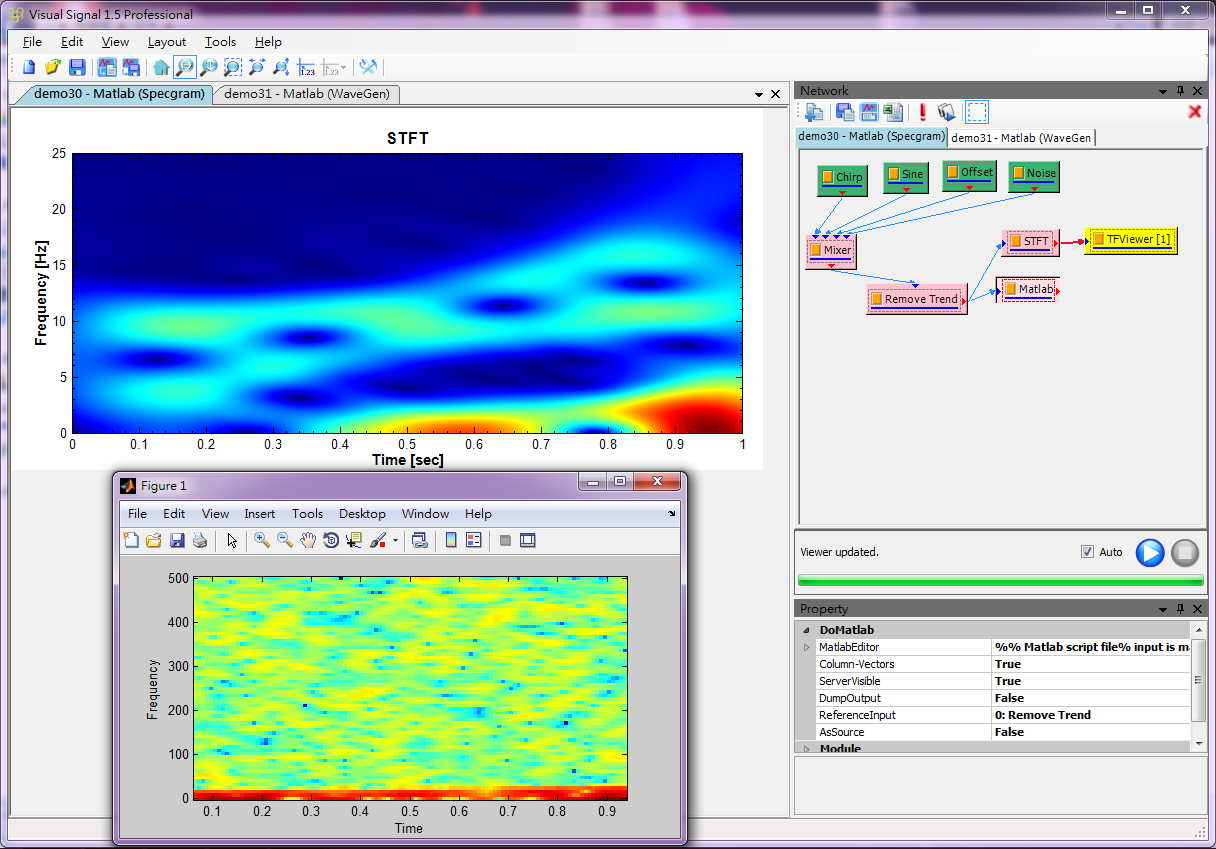
Visual Signal provides a variety of tools to give complete control in signal processing. The control library separates the signal analysis functions into Groups such as channel, filter,HHT,mathematics,time-frequency analysis, and transforms. This function eliminates the complicated ways of writing a program and instead provides an intuitive interface. The interface allows users to drag and create a network of signal analysis functions to reach a desired conclusion quickly and efficiently.
Supports various types of input and output formats:

Visual Signal provides various types of input and output file formats. The supported signal input file formats include tfa, txt, csv, wav, audio files, mat, sac, and wfdb. Data inputted into Visual Signal can be exported as txt, tfa, csv, mat, vsb, and audio file formats. In addition, the data provided can be directly exported into excel. Visual Signal also has full compatibility with the MATLAB engine and can exchange data with MATLAB, while utilizing MATALB's computing. All of the graphs can also be exported as png, bmp, tif, jpg, and wmf, with clipboard support.
Data visualization tools:

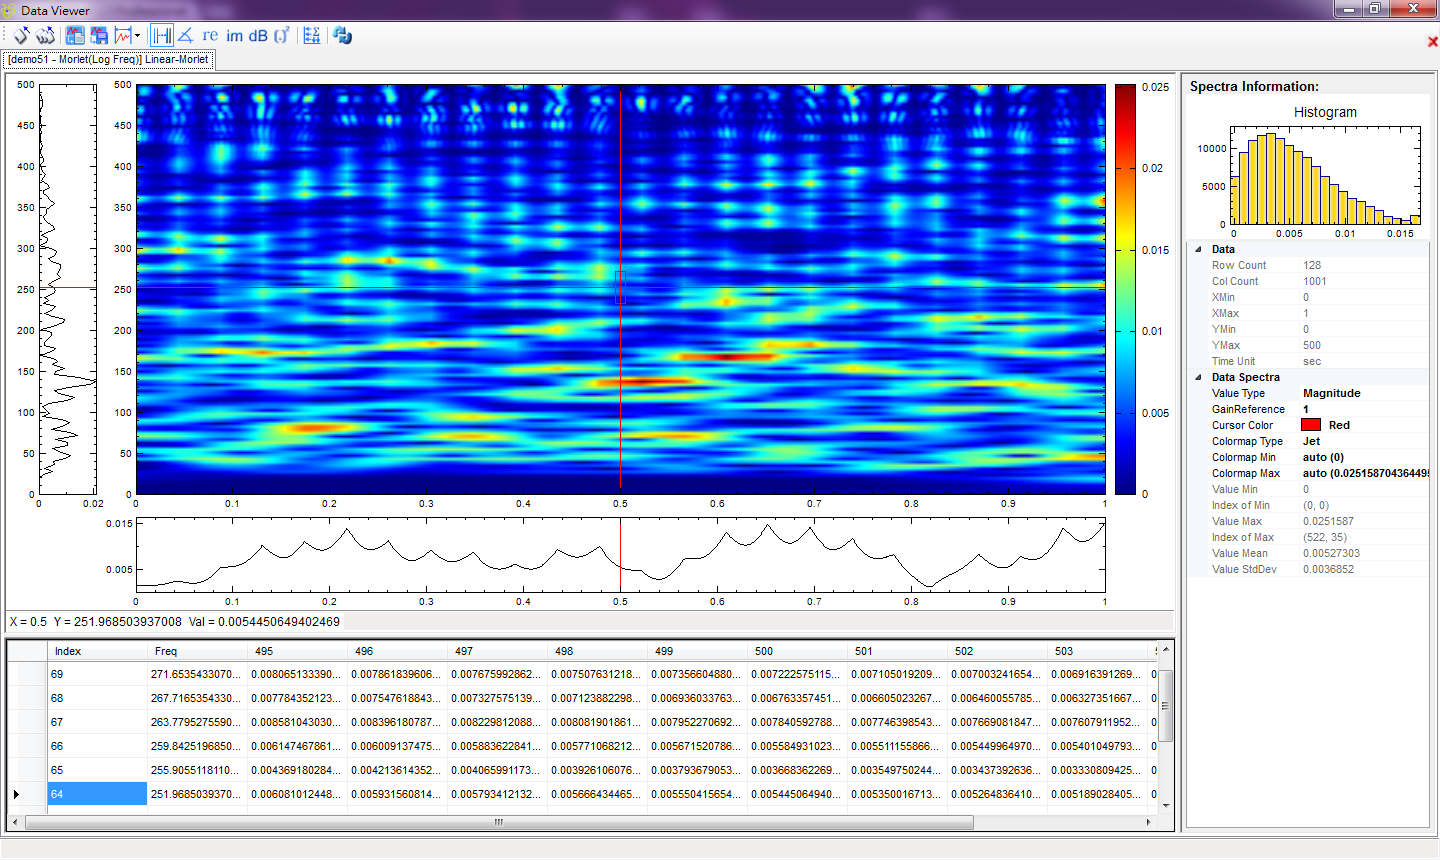
Visual Signal provides great tools forrendering graphs and viewing relevant data. The drawing window is divided into "multiple windows display mode", "multi-channel display mode", and "time-frequency analysis display mode" to make sure users see all relevant information. Every graph produced has the ability to be completely customized. While the Data Viewer tool can detect outliers or extreme values, provide information on numerical data, and see more detailed distribution information of a signal.
Various Solutions for Time-frequency analysis:

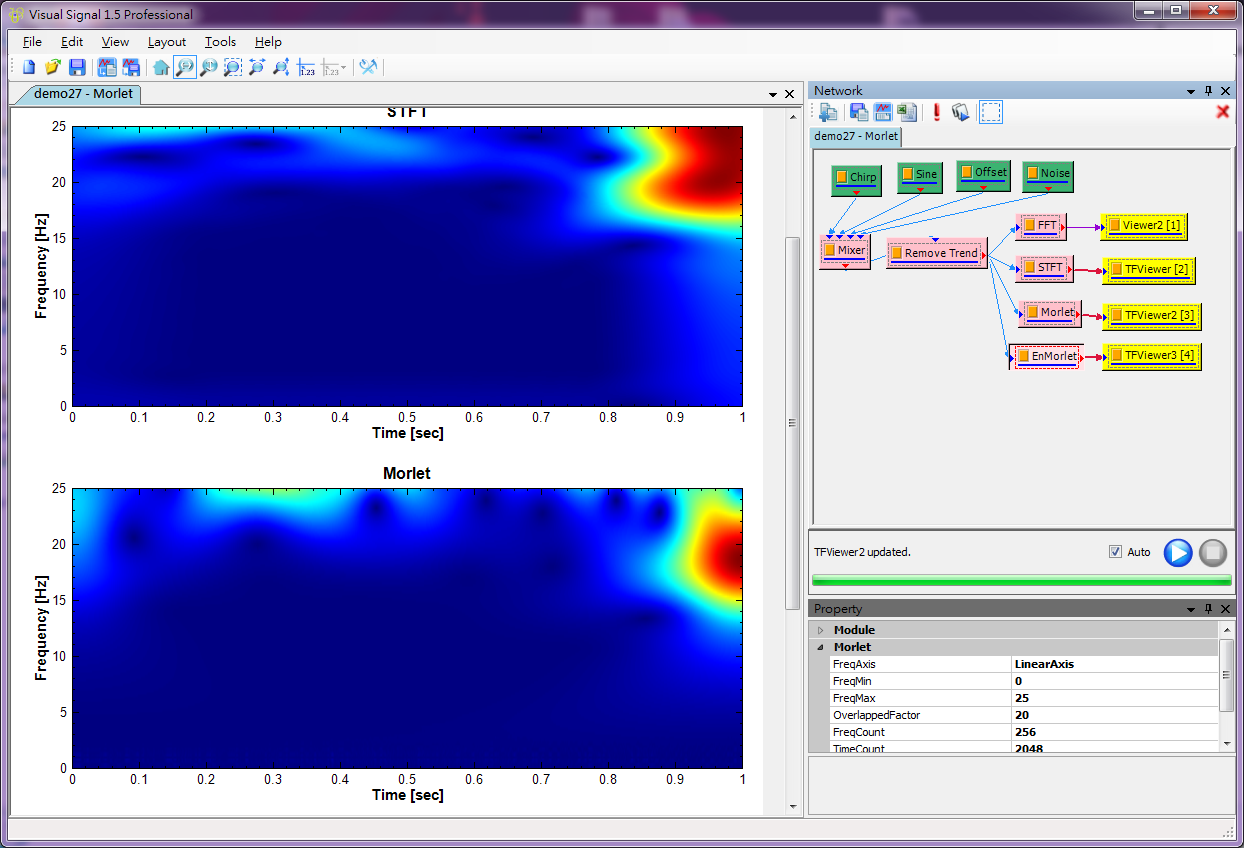
Time-frequency analysis cover a broad spectrum of solutions that Visual Signal provides. The solutions include Hilbert Huang Transform, Morlet Transform, Enhanced Morlet Transform, Short Time Fourier Transform, and more.
Real-time data acquisition compatibility:
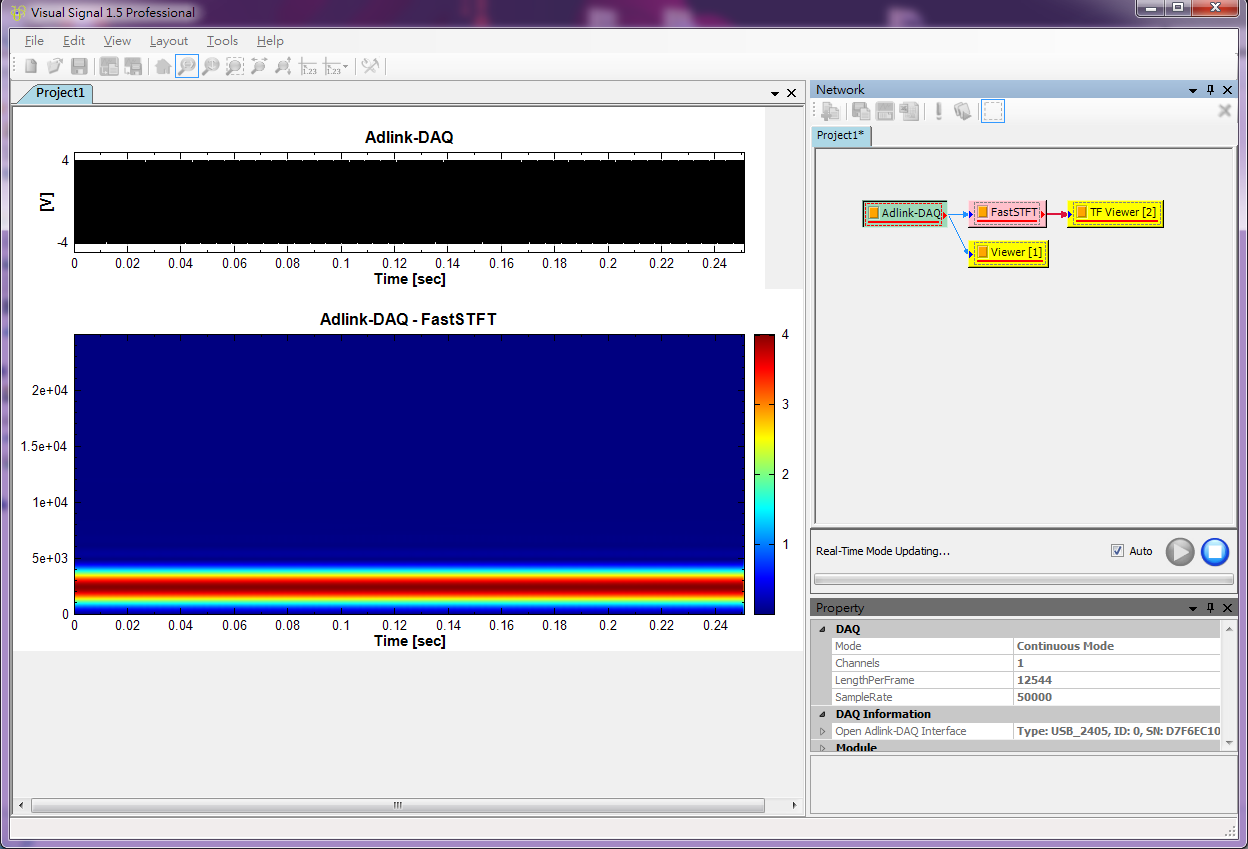
Visual Signal has compatibility with various data acquisition devices from manufacturers such as National Instruments, ADLINK, and Neurosky with more supported devices continuously being added. These devices allow data to be recorded directly into Visual Signal without the inconvenience of exporting data from a recorder and making sure the data is compatible. Using these compatible devices with Visual Signal also gives you the function of recording data in real-time. This will let you manipulate the data and visualize it while it is being acquired.
Add-On Capabilities:

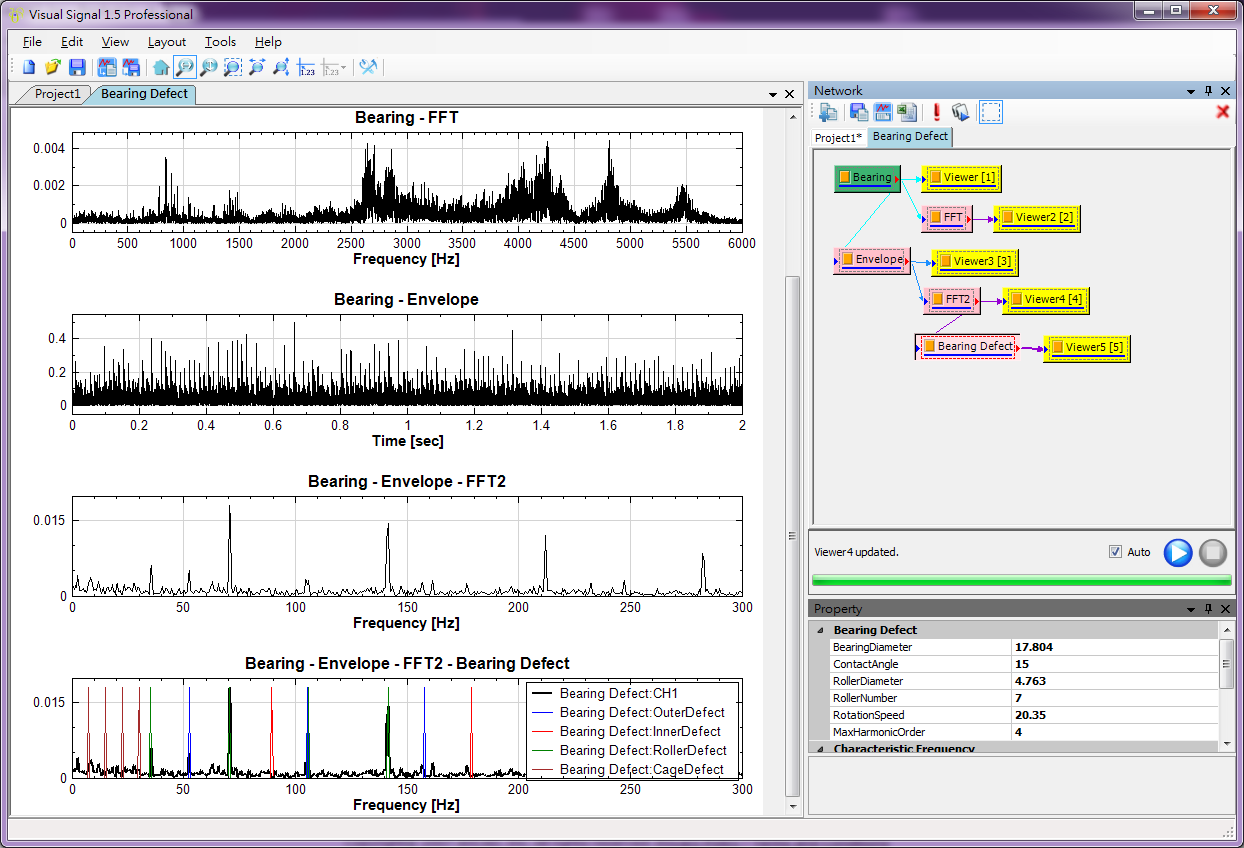
Visual Signal has add-on capabilities that provide a variety of functions for specific needs. In the case of the Sound and Vibration add-on, there are functions that relate to machine monitoring and analysis. This is especially important in industries where QA and machine, acquire the data, apply sound and vibration modules to the data, and visualize the resulting data all in real-time.

 MATFOR