 |
Real-time
Fortran Visualization Programming |
Things you must know if you are thinking about visualizing and animating your simulations in Fortran environment within 5 minutes.
MATFOR, an advanced visualization toolkit built on Fortran environment is specially designed for programmers in scientific computing field. If you want to produce some high quality 2D/3D visualization or movie-presentation, and don’t want to waste your time on post-processing, MATFOR is your best choice.
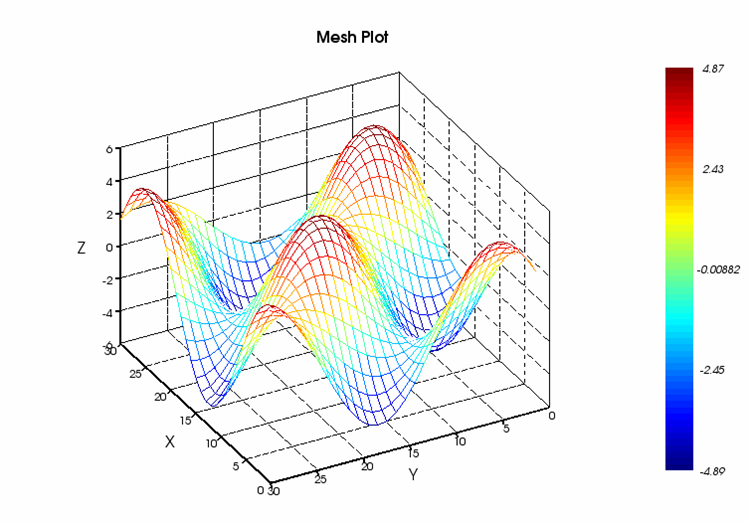
By adding a few lines of MATFOR codes to your Fortran program, you can easily visualize your computing results, perform run-time animations, or even produce a movie presentation file as you execute your program. MATFOR provides a user-friendly and simple environment for implementation without going into the trouble of Windows programming. No previous Windows or graphics initialization is needed. Example I illustrates how the mesh plot procedure is embedded in Fortran program.
|
|
|
Example 1: Mesh plot embedded in Fortran program. The right hand figure is the plotting result and the general steps of producing a mesh plot. |

|
|
|
Step
1:
Add use fgl under your program name |
In this case, you only need 5 steps to create a visualization. Don't you want to visualize your Fortran data in this way too?
AnCAD, Inc.
5F, No. 67, Sec.
1, Yung-Ho Rd.,Yung-Ho City, Taipei,Taiwan
Tel: +886 2 8923 5411 Fax: +886 2 2928 9364
http://www.ancad.com
sales@ancad.com