|
|
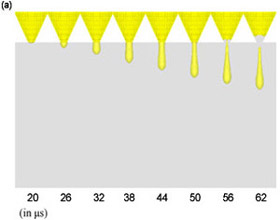
(a) simulated results
|
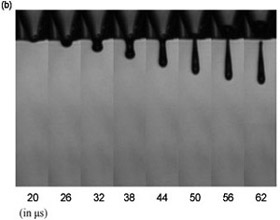
(b) experimental image
|
Figure
above: Front views of the simulated ejection sequences(visualized
using MATFOR)
and corresponding experimental image between 20-62µs. |
|
Three-Dimensional Simulation of a Piezoelectric Micro-Inkjet
Print System
|
The
three-dimensional computer-aided analysis system is developed
to simulate the formation, ejection, and impact of a liquid
droplet of a squeeze-tube type piezoelectric inkjet printing
device. Simulated results are compared to corresponding
experimental observations to verify accuracy of the analysis
system. Results of the simulated data are visualized flawlessly
with the help of MATFOR.
|
Data
courtesy of:
Hsuan-Chung
Wu and Weng-Sing Hwang,
Department of Materials
Science and Engineering, National Cheng Kung University,Taiwan
Huey-Jiuan
Lin,
Department of Materials
Science and Engineering, National United University,Taiwan
|
Seeing is believing—
Realistic Animations with MATFOR |
|
|
Figure above: Movie-like representation of computed
data from simulation visualized
using MATFOR
(a)
3-Dimensional view of simulated print nozzle
(b) Flat view of
simulated print nozzle
(c) Flat view of
simulated print nozzle using slice
representation
|
 Try
MATFOR Now
Try
MATFOR Now
|
| Simulated results graphically displayed
using MATFOR are rather consistent with experimental observations.
The numerical experimentations show that as the droplet’s
surface tension decreases, break-up time increases, length
extends, flying velocity increments, and its tail also extends.
The droplet is relatively unstable, which is undesirable
for printing quality. As viscosity increases, effect on
the break-up time isn’t obvious. However, length decreases,
flying velocity decrements and its tail also decreases.
Thus, the droplet is more stable and desirable for the printing
quality. The simulated results displayed using
MATFOR are
also animated in a real-time movie-like presentation
as shown above. |
Beyond your expectation…
MATFOR – the Quick, Easy-To-Use Scientific Visualization
Toolkit
|
The scientific
computing industry often requires large data processing.
Processing the data can often be a long and tedious procedure,
especially if the developer desires to view the information
in graphical format. Fluid Dynamics,
one of many fields in the scientific computing industry,
is no exception.
MATFOR, developed by AnCAD, Inc., is a set of
graphical and numerical libraries specifically
designed for the scientific computing industry. By adding
merely a few lines of MATFOR
code in the developer’s program, the developer is
able with ease to view the data in a
graphical display. YOU developer will
save time processing data by using MATFOR,
which in turn allows for more actual research time.
|
For
realistic, experiment-like graphics…
MATFOR--the LATEST trend for scientific computing...
Try
MATFOR Now
|
|
|
| |
|