
Speed Up Matlab
When neither Matlab nor Fortran provides high-performance visualization capabilities madly demanded by the market, what do we do?
When neither Matlab nor Fortran provides high-performance visualization capabilities madly demanded by the market, what do we do?
Today, simulation performance is no longer just a matter of excellence but a theme of survival. As scientific computation soars at an unprecedented pace, scientific data dramatically increases in both quantity and diversity, leading to the inevitable trend of parallel programming. To keep up with the trend, scientists and engineers must soon face the imminent needs for high-performance data analysis and simulation tools that are simply not available today. Anticipating this upcoming challenge, AnCAD proudly presents an innovative all-in-one solution incorporating problem simplification, program integration, and result visualization, all at the same time.
Matlab and Fortran's Deficiencies
In the market of scientific computation, Fortran 90/95 and Matlab have always been the two dominating tools. As an array-based language, Fortran pioneered in utilizing vectorization to enhance code efficiency by chaining scalar operations into vector operations. Despite its high efficiency, Fortran has not been well-supported by many quality visualization libraries, making it difficult to code and generate graphical simulations. Meanwhile, Matlab has made every possible attempt to reduce execution time by enhancing vector programming for repetitive codes. However, although enjoying more supports in graphics, Matlab runs adequately often only for prototyping but not for dynamic simulation as its embedded data structure prevents any significant speed improvement. Because of incompatibility between Fortran and Matlab, scientific computation community today is left with a painful choice between high performance and powerful visualization, a gap that desperately needs to be bridged.
MATFOR, Bridging the Gap
To date, manual translation from Matlab to Fortran has been the preferable, if not the only, way to enhance Matlab performance. Such manual translation between Matlab and Fortran, however, often involves time-consuming complexity. Clearly, Matlab and Fortran must communicate to solve this predicament, and MATFOR – an innovative bridging tool incorporating the advantages of both – emerges to be the major driving force. MATFOR, a set of numerical and visualization libraries, enables scientists and engineers to code in a Matlab fashion using the special Matlab-like language, MATFOR in Fortran, while performing the actual computation in the high-speed Fortran environment. In addition, MATFOR provides both Matlab and Fortran programmers with advanced visualization capabilities. MATFOR's functionalities can be utilized in a variety of fields, including solid mechanics, computational fluid dynamics, molecular simulation, and electromagnetic analysis. Remarkable in precision, performance, and visualization quality, MATFOR is a must-have for any Matlab and Fortran user who demands high-performance visualization.
Try MATFOR.
A High-Performance Toolkit
MATFOR was developed based on Fortran 90/95 and C/C++ libraries. It utilizes vectorization and parallelization technologies to minimize execution time. In addition to its power in code integration and data visualization, MATFOR provides other advanced features such as run-time animation, movie presentation, and standalone-executable conversions. The "Graphic Viewer" of MATFOR overcomes the need for post-processing and instead instantly visualizes scientific and engineering data at run-time. More impressively, the "Graphics Export" feature converts visualization files into standalone executables, enhancing publication and presentation of the results by increasing their portability and compatibility.
A Case Study – A Scientist's Perspective on MATFOR
Optimizing simulations with ease is every scientific programmer's dream. Dr. Pei-Kun Wei from Academia Sinica, Taiwan, was one such programmer who used to analyze his data and to visualize his results using the most popular simulation tool – Matlab. Although a loyal Matlab user, he was often unsatisfied with Matlab's performance. When he discovered MATFOR in 2002, a brand new journey of his scientific exploration began.
Dr. Wei has researched in the field of Photonic Band Gap (PBG) for several years, and Matlab was the only tool he employed to conduct scientific computations. To mitigate the problem of poor performance and the difficulty of sharing and publishing the results, he knew he had to translate his Matlab programs into another language. As an excellent scientist proficient in various programming languages, Dr. Wei recognized that Fortran would be the preferred choice to translate Matlab into because of the similarities between the two languages.
After months of searching, he finally found MATFOR. He was delightfully surprised by this wonderful toolkit because it readily solved all of his problems in high-performance visualization. It was not until later Dr. Wei realized that the inventor of MATFOR actually had the same frustrations as he did, which resulted in the birth of this remarkable tool. Now, not only are Dr. Wei's research programs enhanced by higher visualization performance but he is also able to present and share his research results with much greater ease. MATFOR has changed Dr. Wei's research life forever.
A Bridge between Matlab and Fortran
With the assistance of MATFOR, translating Matlab into Fortran has never been easier. In the following table, we summarize the similar syntaxes between Matlab and MATFOR in Fortran (a special Matlab-like language). Any seasoned programmer can easily see how readily a Matlab program may be translated into MATFOR in Fortran.
Matlab | MATFOR in Fortran |
Basic Assignment | |
| a=1+2i | a=(1,2) |
| a=[1,2,3]' | a=.T. (/ 1, 2, 3 /) |
Operator | |
| a=x \ y % solve for x * a = y | a=mfLDiv(y, x) |
| a=y / x % solve for a * x = y | a=mfRDiv(y, x) |
| a=1:2:99 | a=1:99:2 |
Math Function | |
| a=inv(x) | a=mfInv(x) |
| e=eig(x) | e=mfEig(x) |
Visual Function | |
| surf(x,y,z) | mfSurf(x,y,z) |
| h=plot(x,y,':') | h=mfPlot(x,y,':') |
Example Code
The following code segment is a loop example adopted from the source code of Dr. Wei's research project – Waveguide Transmission in a PBG System. One can make a line-to-line comparison between the two languages.
|
|
Run-time Animation of Wave Simulation
Many subjects in the scientific computing field are related to wave simulations. Please see below for the demonstration of Dr. Wei's PBG system. Figure 1 and Figure 2 show the waveguide transmission in a PBG system simulated in Matlab and in MATFOR, respectively. Figure 3 is yet another way to present the same simulation using MATFOR. By adding a few lines of MATFOR codes, the Fortran program can be visualized in three-dimensional mode, clearly illustrating the energy exponentially decaying due to destructive interference.
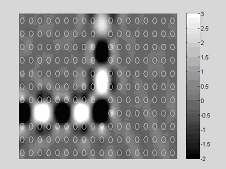 Figure 1. Simulation of waveguide transmission in a PBG system using Matlab | 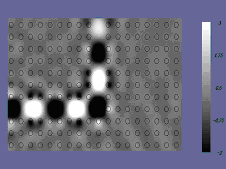 Figure 2. Simulation of waveguide transmission in a PBG system using MATFOR |
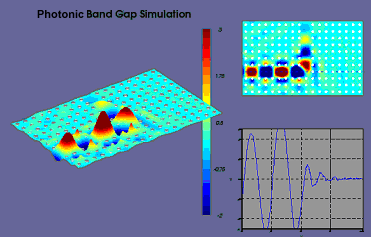 Figure 3. Simulation of waveguide transmission in a PBG system using MATFOR to show the 3D effect |
|
Performance Gains
The benchmark comparison of the PBG simulation produced with Matlab and that with MATFOR in
Compaq Visual Fortran is shown below. The result clearly explains a significant improvement running
MATFOR than Matlab. MATFOR's performance is nearly five times faster. For further performance
comparison, the source codes for both versions are available for download here.
Compaq Visual Fortran is shown below. The result clearly explains a significant improvement running
MATFOR than Matlab. MATFOR's performance is nearly five times faster. For further performance
comparison, the source codes for both versions are available for download here.
| OS: Windows XP SP2 CPU: Intel Pentium-M 1.6G RAM: 512MB VGA: NVIDIA GeForce FX Go5200(32 MB RAM) | ||
| Benchmark Target | MATLAB 6.0 | Compaq Visual Fortran 6.6B + MATFOR in Fortran 3.2 |
| Execution time | 869.36 sec (about 15 minutes) | 181.66 sec (about 3 minutes) |
Don't Be Left Behind
As the last upgrade in the final steps toward version 4.0, MATFOR 3.2 concentrates on the introduction of mfPlayer, which is one exclusive visual tool to record and preset data simulations. It also offers compelling localization features, providing multi-language support. Please visit www.ancad.com for further details on MATFOR. For immediate attention, please contact support@ancad.com.
Try MATFOR.