As
the development of advanced magnetic materials continues to make
enormous progress, more and more researchers are devoted to the
field of magnetics. Some applications including magnetic sensors,
recoding heads and magneto-mechanic devices all consist of spatially
distinct ferromagnetic parts. Because the size of these applications
is becoming smaller each day, researchers are continuously looking
into magnetic components in nanometer regime, which leads to the
use of micro-magnetic simulations.
Micro-magnetic
Simulations
Micro-magnetics is the study of magnetization processes in ferromagnetic
materials. Researchers use micro-magnetic simulations to learn
the magnetic behavior hence to predict the magnetic properties.
Until recently, most existing graphical tools only allowed presentation
with static graphs; to present the motion of magnetization could
be very difficult without a full-functioning graphical tool.
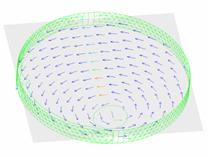
Figure
1. Demonstration of magnetic vector distribution
and charge distribution in static graphs using an existing graphical tool.
Using
MATFOR in Micro-magnetics
Dr. Lee, Ching-Ming has researched the field of micro-magnetics
in several years. He was once very frustrated with not being able
to conduct a quality simulation. However, the limitations of existing
graphical tools restricted Dr. Lee to present his simulation results
with only static graphs. In order to visualize the magnetic behavior,
skimming through thousands of snapshots for the simulation was
the only option available. In contemplation of presenting micro-magnetic
simulation with dynamic visualization, MATFOR came across his
attention. The discovery of MATFOR reassured Dr. Lee's confidence
in creating a dynamic interpretation of the simulation.
To
Show Rather than to Explain
Based on finite elements method, Dr. Lee utilized the Landau-Lifshitz-Gilbert
equation to compute the magnetic field. He collected the numerical
data yielded from the computation and graphed them using MATFOR
embedded graphical libraries. Not only was he able to view the
animation of magnetization processes, he was able to record the
simulation into a movie file with only a few lines of code. In
addition, the ability to create a standalone movie presentation
also impressed Dr. Lee. He strongly felt the communication being
enhanced through the use of MATFOR; teaching was much easier for
Dr. Lee because he was able to show rather than to explain the
magnetic behavior to his students.
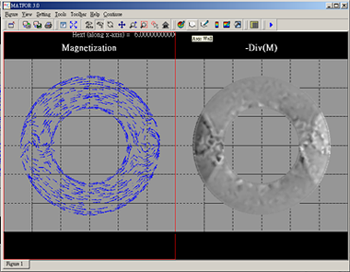
Visualizing the Simulation Results
The simulation of micro-magnetics helps in the study
of magnetic behavior including the structures and the domain walls
of magnetic materials. In Figure 2, on the left, the simulation
illustrates the domain plot with arrows indicating the direction
of magnetization. With MATFOR, the magnetic vector can be presented
with quivers, and the motion of each lattice node can be visualized
as it changes direction. On the right, the simulation demonstrates
the surface plot of a domain wall in thin magnetic film. One can
visualize vortice formation in a nano-element through the animation
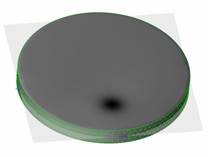
created using MATFOR libraries. Figure 3 displays the magnetic
material using mesh plot.
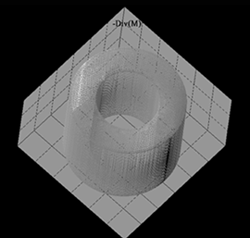
Creating
Dynamic Presentation with MATFOR
A dynamic presentation can be created using MATFOR. By calling
msRecordStart('movie.avi'), the simulation results can be recorded
into an AVI file. The complete video clip can be viewed using
any media player that supports AVI file.
 |
| Figure
4. Using MATFOR to record the simulation into a movie
file and use any media player to play it. |
Download MATFOR Now!
MATFOR not only allows you to create real-time animation, to make
an interactive movie presentation is also a few lines of code
away. To download MATFOR, please go to http://www.ancad.com/download.php
. For more information, please visit http://www.ancad.com
.
Field data provided by
Professor Lee, Ching-Ming
Department of Electrical Engineering
Chungchou Institute of Technology, Taiwan