|
Couldn't find an appropriate
colormap to apply to your object? How about creating one your
own?
|
|
The Fundamental
Technique of MATFOR : Colormap Customization
|
Visualization
is the process of mapping data onto images, and color is the primary
element for producing
an effective visualization. A successful
visualization of a simulation enables users to gain insight into
the structure of the data, and this usually depends on the
selection of colormaps.
Often times, standard
colormaps provided with visualization tools
may
not adequately present the simulation data;
MATFOR's colormapping technique, however, provides a way of designing custom
colormaps to ensure
the quality of the visualization. In this newsletter, we will
take a step further to talk about the enhanced colormap features
of MATFOR
4, and how to define, modify and use colormaps. |
| |
|
|
Using the Predefined Colormaps
|
MATFOR
provides a variety of predefined colormaps including spring, winter,
cool, hot, gray and more. These colormaps can be selected in programming
or through the colormap dialog box. As an extended feature in MATFOR 4, each colormap can be assigned to an object in the plot that contains multiple objects. Additionally, users can specify
a certain range of a displayed object to be colored or discarded
using the
colormap properties. Available properties include 'clamp', 'range'
and 'undef'.
...
h = mfSurf(u,v,z)
call msColorMap('spring')
! Use spring as the colormap type
call msDrawColormap(h, mf('range'), mf((/-2d0, 3.9d0/))) ! Specify the colormap range between -2 and 3.9
call msDrawColormap(h, mf('undef'), mf('no_drawing')) !
Hide the area outside of the colormap range
...
h1 = mfSurf(u,v,z)
call msColorMap('summer') ! Use summer as the colormap type
call msDrawColormap(h1, mf('range'), mf((/-2d0, 3.9d0/))) ! Specify the colormap range between -2 and 3.9
call msDrawColormap(h1, mf('undef'), mf((/1,1,1/))) !Color the area outside of the colormap range to white
...
|
The object on the left uses the colormap 'spring', and the undefined area is set to transparent; the object on the right uses the colormap 'summer', and the undefined area is colored in white.
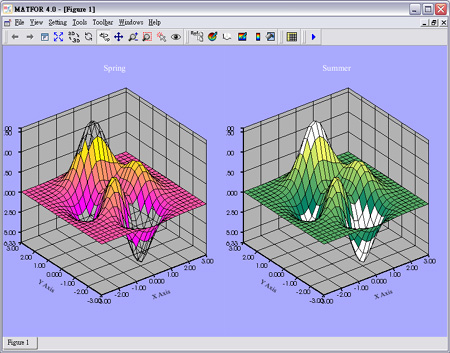
Figure 1. Using different types of predefined colormaps |
|
|
|
Defining
a Custom Colormap
|
|
In case none of the predefined colormaps
is suitable for the object, a custom colormap can be created using
the colormap editor in the Colormap Setting dialog box:
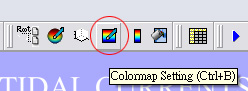
1. In MATFOR Graphics Viewer, click the Colormap Setting button on the Toolbar to open the dialog box.
The object on the left uses the colormap 'spring', and the undefined area is set to transparent; the object on the right uses the colormap 'summer', and the undefined area is colored in white. |
2. On the left, you will see the colormap editor with two color stops.
In order to change colors on the colormap, select one of the
stops and click the color button  . .
 |
3. Choose the desired color and click OK.
4. To add new color stops, simply click the plus button  . By default, the new stop will be placed at the midpoint of the two previous stops. Slide the new stop to the proper position. . By default, the new stop will be placed at the midpoint of the two previous stops. Slide the new stop to the proper position.
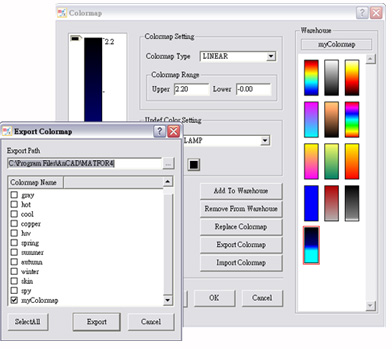
5. When you are done setting up the colormap, click the Add to Warehouse button and type in a custom name “ myColormap ”. The new colormap will be shown in the Warehouse.
|
6. To save colormaps onto local
disks for later use, click the Export Colormap button.
Specify the location and colormaps to be saved then click Export.
The colormap files will be saved in the path specified with the extension
.mfcm.
Note: By default, MATFOR uses the
directory where the project is saved. It is recommended that the custom
colormap files be saved under the same directory as the project.
 |
| |
|
|
Modifying an Existing Colormap
|
|
When there are multiple objects existed in the graph, the colormap for each object can be modified individually.
1. In MATFOR Graphics Viewer, click the Object List View button to open the Graph Tree dialog box.

|
2. Under the graph tree, select the object to which the colormap is applied.
3. Click the Add/Edit Colormap button to modify the colormap. |
|
|
|
|
An Example Using Different Colormapping Techniques
Data courtesy of Department of Marine Meteorology, Central Weather Bureau of Taiwan |
|
The example below is a simulation of tides and tidal currents around the seashores of Taiwan. In this example, two objects are created with layers sitting on top of one another. The custom colormap "myColormap.mfcm" is applied to the top layer for the ocean while the predefined colormap "summer" is applied to the bottom layer for the land.
Figure 2. Simulation of tides and tidal currents
|
...
h1 = mfSurf(mx, my, mhsig) ! Create and plot the ocean layer
call msDrawMaterial(h1,mf('edge'),mf('visible'),mf('off')) !
call msDrawColormap(h1, mf('ocean.mfcm')) ! Use the custom colormap type - ocean
call msHold('on')
...
h2 = mfSurf(cx,cy,cz) ! Create and plot the land layer
call msDrawMaterial(h2,mf('edge'),mf('visible'),mf('off'))
call msDrawMaterial(h2,mf('surf'),mf('smooth'),mf('on'))
call msDrawColormap(h2,mf('summer')) ! Use the predefined colormap type - summer
call msDrawColormap(h2,mf('range'),mf((/1d-4,2.5d0/))) ! Set the colormap range between .0001 and 2.5
!call msDrawColormap(h2,mf('undef'),mf('no_drawing')) ! Hide the area outside of the colormap range
...
Figure 3. Setting 'undef' to 'no_drawing' on the land layer hides the unwanted area (that is set outside of the colormap range) |
|
|
Download MATFOR 4 now to create your own colormaps! Please contact sales@ancad.com for more information. |
|
|
